
Power BI Desktop
Power BI Desktop: A Powerful Tool for Business Analytics
The growth of business intelligence and data analysis has paved the way for innovative tools - and few are as voraciously adopted as Power BI Desktop. This comprehensive platform for data visualization has revolutionized the way businesses conduct data-driven decision making.
Introduction to Power BI Desktop
Power BI Desktop is a revolutionary application for the visual representation of data generated by Microsoft. Through a thoroughly streamlined interface, it allows users to design interactive reports and dashboards. This tool is specifically designed for businesses and enables them to extract essential insights from their vast data repositories. As a desktop application, Power BI offers an advanced user-friendly platform for those who require dynamic and interactive reporting capabilities.
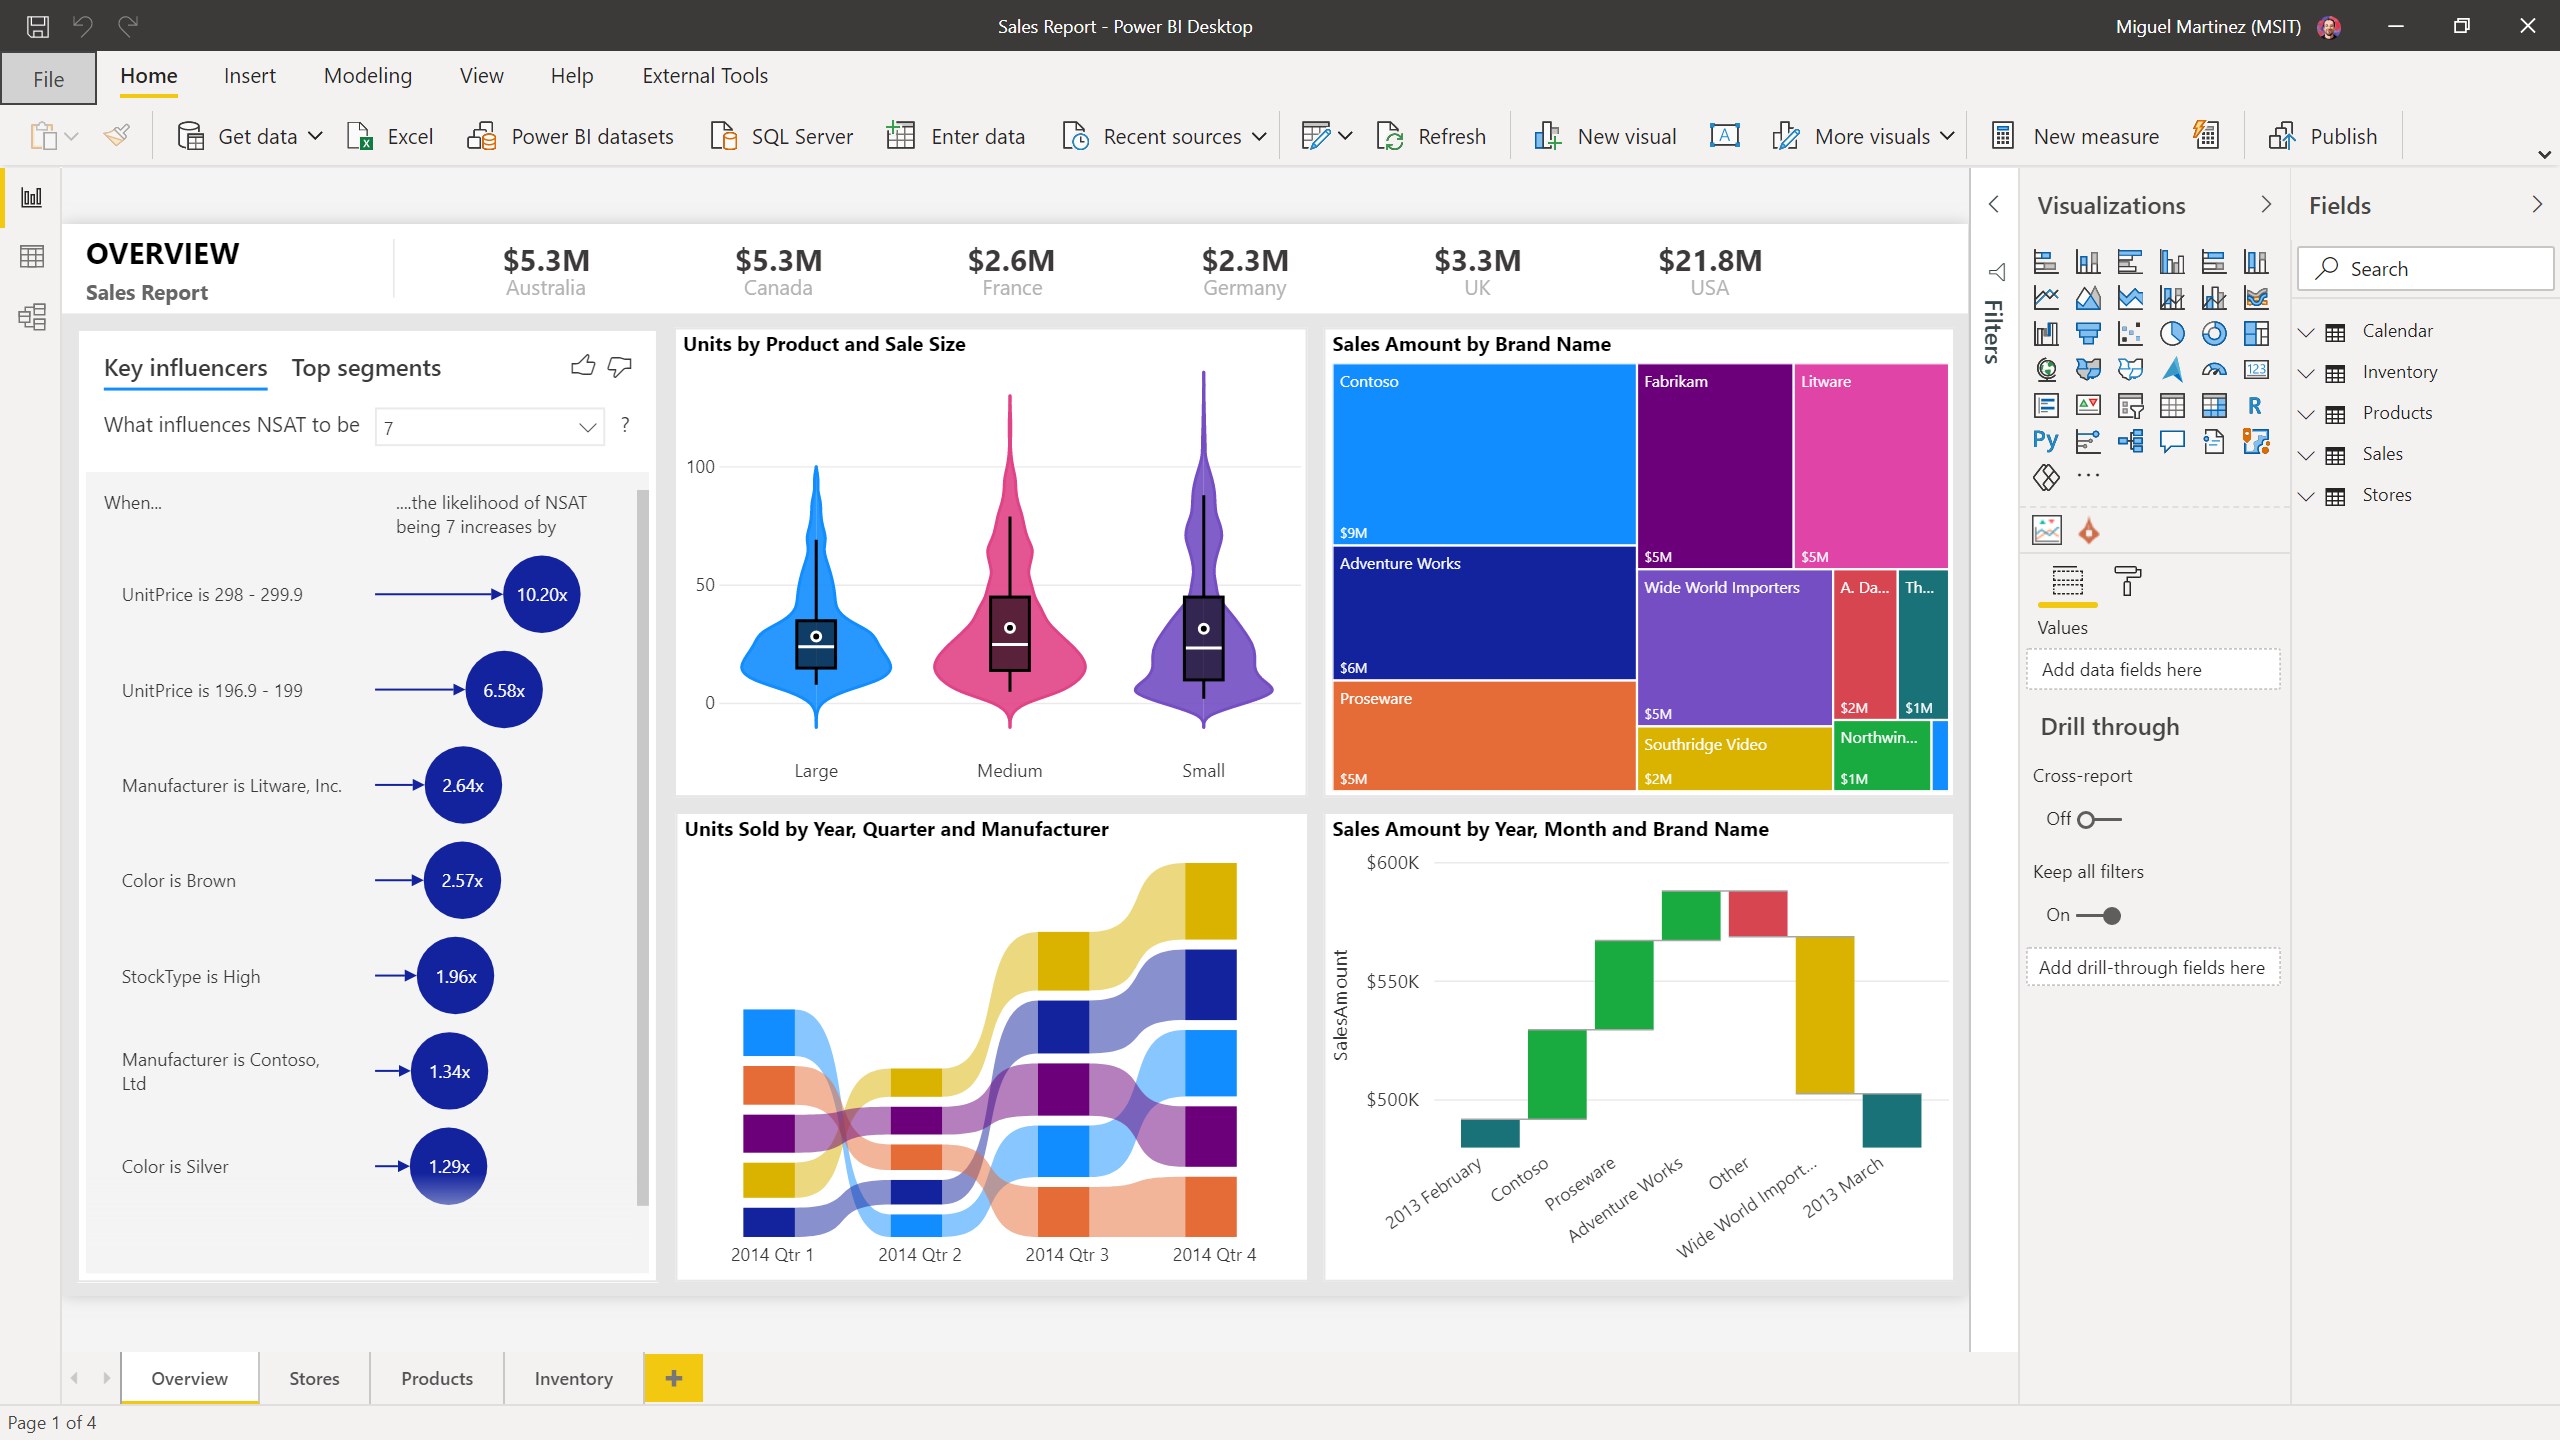
The Power of Visual Data Analysis
With Power BI Desktop, businesses no longer need to rely on complex spreadsheets or outdated data presentation software. The platform supports drag-and-drop features, making it possible for users of varying skill levels to create compelling visuals. Power BI Desktop can convert raw figures into accessible visual representations, ranging from pie charts and maps to gauges and treemaps, all in real-time. This provides a comprehensive view of business data, enabling informed decision-making.
Interactivity and Customization with Power BI Desktop
Power BI Desktop takes interactivity and customization to a new level. Users can adapt and manipulate the interactive components on visuals such as slicers, drillthroughs, and report tooltips. As users interact with the visual components, the data dynamically adjusts, presenting new insights instantly.
Powerful Querying with Power Query
Power Query in Power BI Desktop is a fundamental feature. It integrates powerful querying capabilities with a user-friendly interface. Power Query gives businesses the flexibility to combine data from various sources, structure it, and create subsets that are most useful. This enhances dynamism, simplifies data manipulation, and accelerates data analysis processes.
Data Modeling with Power Pivot
Another key component of Power BI Desktop is Power Pivot. It simplifies the modeling of complex data, allows users to organize and analyze large volumes of data efficiently. Power Pivot's data modeling potential is its ability to create relationships between different datasets. This component of Power BI Desktop makes the analysis straightforward and effective, making it possible to derive profound insights.
Power BI Desktop within the Business Intelligence Ecosystem
As part of the broader Microsoft Power BI suite, Power BI Desktop serves as an integral tool for businesses that demand advanced data analytics capabilities. Its ability to connect with a wide variety of data sources, including Excel, SQL Server, SharePoint, and many others, makes it an ideal choice for businesses.
Conclusion
Power BI Desktop serves as a revolutionary data visualization and reporting tool, which equips businesses with the power to turn data into actionable insights. As a dedicated desktop application, it offers flexibility, robustness, and tailor-made features for an unparalleled business intelligence experience.